
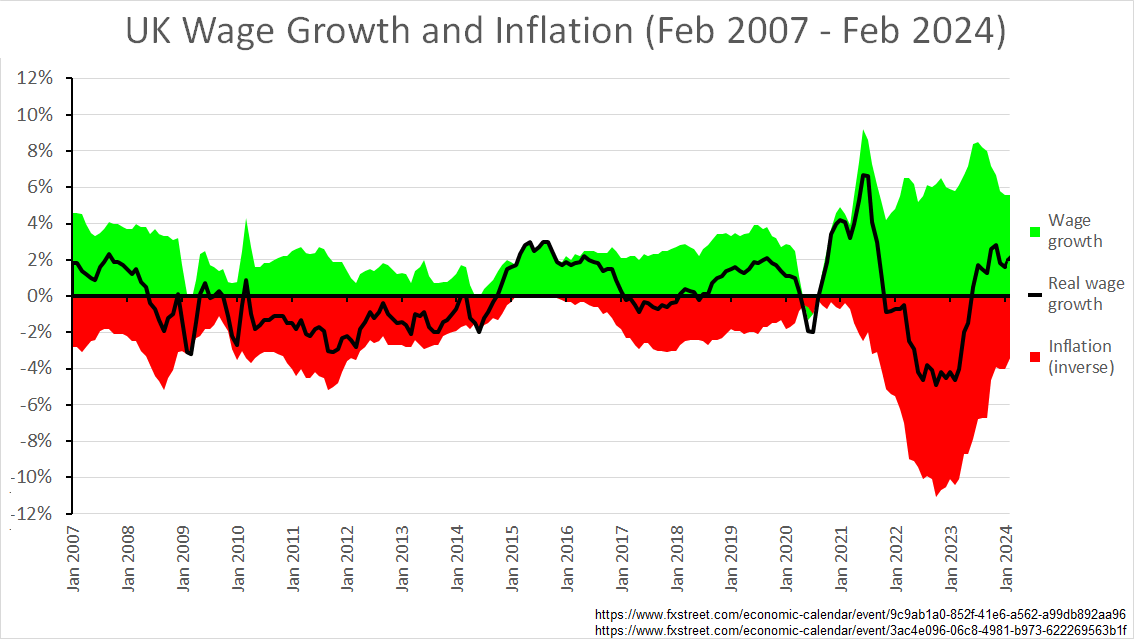
I combined the data from today’s wage growth figures with their corresponding inflation figures to help people visualise real wage growth/contraction over the last 17 years (all available data). You can clearly see the 2022 inflation surge (red shaded area), the corresponding cost of living crisis (black line circa April 2022 – March 2023), the tight labour market over the last 3 years (green shaded area) as well as Covid, the great recession, contagion from the eurozone debt crisis and possibly other major economic events.
https://i.imgur.com/7tfEilZ.png
[Source for earnings data.](https://www.fxstreet.com/economic-calendar/event/9c9ab1a0-852f-41e6-a562-a99db892aa96)
[Source for inflation data.](https://www.fxstreet.com/economic-calendar/event/3ac4e096-06c8-4981-b973-622269563b1f)
https://old.reddit.com/r/unitedkingdom/comments/1c5d02v/uk_wage_growth_and_inflation_feb_2007_feb_2024_oc/
Posted by yojifer680
2 Comments
[https://www.reddit.com/media?url=https%3A%2F%2Fi.redd.it%2Fwages-in-the-uk-have-been-stagnant-for-15-years-after-v0-3u6xryfwb0sc1.png%3Fs%3D97ac470e4ab87e886fc88513efc225d40f1f226c](https://www.reddit.com/media?url=https%3A%2F%2Fi.redd.it%2Fwages-in-the-uk-have-been-stagnant-for-15-years-after-v0-3u6xryfwb0sc1.png%3Fs%3D97ac470e4ab87e886fc88513efc225d40f1f226c)
This is the better way of visualising it.
You can extrapolate that trend back to 1990 and it still works.
Britain has never recovered from the crash.
It would be useful to see the cumulative growth as well.